
See what connects.
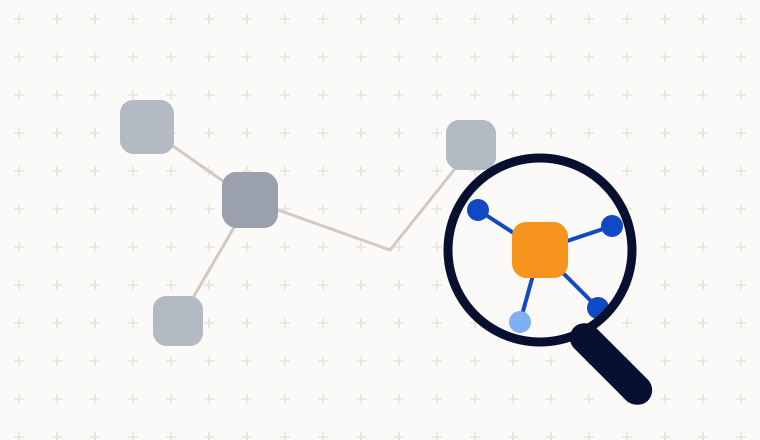
Inspect paths, time and location in Link Charts. Use the DataWalk ML graph extension to calculate centrality, detect communities and derive network features.

By Solution
Explore the Platform
All Resources
Investor Relations
Start with curated, connected data. Test hypotheses with visual queries, graph algorithms and machine learning. Bring new sources into the analysis as your questions evolve.
Enterprise knowledge graph
Do these suppliers have more in common than their payment history?
Each project repeats the work of finding sources, reconciling identities and working out how the records connect.
Following another relationship often means another join, another run and another round of inspection. Exploration becomes query maintenance.
Network features take memory and computation. As data grows, useful experiments can become infrastructure projects.
A machine learning model produces predictions. Getting them into the records and tools analysts use is another job.
Work with the entities, relationships and cleaning rules already defined in DataWalk. Connect another database, file or API to that shared model as your analysis develops.
Combine transactions, business records and events. Entity and relation extraction can bring information from documents into the analysis too.
Analysts and data scientists can explore relationships, calculate across records and test hypotheses on the same connected data. Work visually or extend the analysis with code.
Inspect paths, time and location in Link Charts. Use the DataWalk ML graph extension to calculate centrality, detect communities and derive network features.
Explore distributions and aggregate across connected records. Build queries visually in Universe Viewer, change a condition and save the analysis for reuse.
Find records across configured fields and datasets. Use exact or configured fuzzy matching for name variations, then inspect the results and their connections.
Evaluate models with tabular and network features in JupyterLab. Supported algorithms execute in the database sandbox. Import predictions onto entities for analysts to query.
Combine saved analyses with assigned weights to score entities. Configure an alert when entities enter or leave the results of a saved analysis.
A payment total tells you how much each supplier received. Directorship data lets you examine whether those suppliers are connected.
Connect company-registry records to the suppliers and payments already in DataWalk.
Select a period. Find suppliers with overlapping directorships and calculate their share of payments.
Inspect the records behind the calculation. Change the period and compare. Save the analysis for reuse.
For machine learning, calculated properties such as shared-director counts can become candidate features.
DataWalk’s reported traversal benchmark tested graphs up to 20 TB. Bounded queries recorded median times below one second per hop, with essentially flat latency from hop 2 through hop 15.
20 TB graph · bounded traversal
0.24–0.60seconds per hop
Median range across steady-state hops.
Top 100 counterparties retained per hop. Six-node clusters, warm storage, one user. Broader traversals require more work.
ING combined transaction and relationship features to build customer profiles, then automated monitoring as new data arrived. Scientists and analysts could work with the same behavioural descriptions.
Read the customer storyOnce sources are configured, analysts and data scientists reuse the shared data preparation and relationships. Adding a source requires mapping and refresh configuration. Each modelling task still needs its own feature selection and validation.
Search, visual queries and Link Charts support analysis without writing code. Python, JupyterLab and APIs let data scientists extend the analysis with their own methods.
Yes. DataWalk supports GLiNER-based entity extraction and configured relation-extraction workflows. Link extracted information to existing entities so document content can contribute to search and analysis.
Supported DataWalk ML algorithms run in the database sandbox. Custom Python libraries may need a separate execution environment. Imported predictions need a configured process to rerun the model and update the results.
Yes. DataWalk ingests the data needed for connected analysis. Warehouses and operational systems can remain in place, with APIs and exports connecting the results to other tools.
Architecture & DeploymentBring a question and the sources you need to answer it.
