

An Architectural Blueprint for Dismantling Organized Financial Fraud
Discover how traditional architectures fail to stop organized financial crime. Learn how a unified platform using Graph AI and entity resolution can uncover complex fraud networks, lower TCO, and provide a clear, explainable solution.
Key Takeaways
- Organized Fraud vs. Transactional Rules: Criminal rings exploit siloed systems by spreading synthetic identities across multiple business lines, bypassing single-transaction detection tools.
- The Cost of Tool Fragmentation: Stitching together separate ETL, graph databases, entity resolution engines, and case management suites inflates Total Cost of Ownership (TCO) and slows down investigations.
- Native Entity Resolution: True network visibility requires resolving fuzzy matches and fragmented records across disparate enterprise sources into a master entity view.
- Explainable Composite AI: Combining graph analytics with AI surfaces hidden non-obvious links while preserving auditability and compliance transparency.
- No-Code Self-Sufficiency: Empowering internal teams to adapt rule logic and ingest new datasets eliminates reliance on costly, multi-year vendor service contracts.
According to reports from the US Government Accountability Office, fraud costs the federal government up to $500 billion annually. This isn’t the work of lone actors; it’s the result of sophisticated, organized crime networks that are engineered to exploit a fundamental flaw in most enterprise architectures.
These criminal rings thrive by operating across multiple channels, systems, and even organizations, creating patterns that are invisible to traditional, siloed fraud detection tools. A system that only checks transactions in isolation is blind to a fraud ring that uses stolen identities to attack multiple lines of business simultaneously. For enterprise architects, this creates a costly and unwinnable situation: a fragmented ecosystem of tools that generates massive operational waste while failing to stop the most significant threats.
This article presents a new architectural blueprint. We will show how moving from a patchwork of legacy tools to a unified, AI-powered knowledge graph provides the only viable way to see these networks, dismantle them, and build a more resilient and cost-effective fraud detection capability.
Why Your Current Tools Are Built to Fail
For decades, the approach to fraud detection has been reactive and fragmented. This has led to an architectural model that is not only inefficient but fundamentally incapable of addressing the network-based nature of modern organized fraud.
The Transaction-Only Fallacy
Legacy systems are designed to ask, “Is this transaction suspicious?” when the real question is, “Are the activities across this network suspicious?” Organized fraud rings operate through structured schemes, like using a web of synthetic identities for application fraud or coordinating claims across multiple policies. These complex patterns cannot be detected by analyzing a single event in isolation. While rule-based systems excel at flagging known transactional red flags, they are blind to the subtle, cross-silo connections that signify a coordinated attack.
The Crippling Cost of Fragmentation
The current reality for most architects is a constant, expensive effort to stitch together a fragmented ecosystem. This often includes separate tools for data extraction (ETL), entity resolution, graph visualization/analysis, and case management. This model forces a reliance on expensive, ongoing professional service contracts just to integrate a new data source or modify a rule. The architecture itself becomes the primary obstacle, trapping valuable intelligence in silos, creating massive customer friction from false positives, and dramatically inflating the Total Cost of Ownership (TCO).
Dismantling Complex Fraud Networks at Scale
Discover how a major institution unified fragmented datasets into an enterprise knowledge graph, cutting investigation times and exposing hidden organized crime rings.

The New Blueprint: A Unified Intelligence Platform
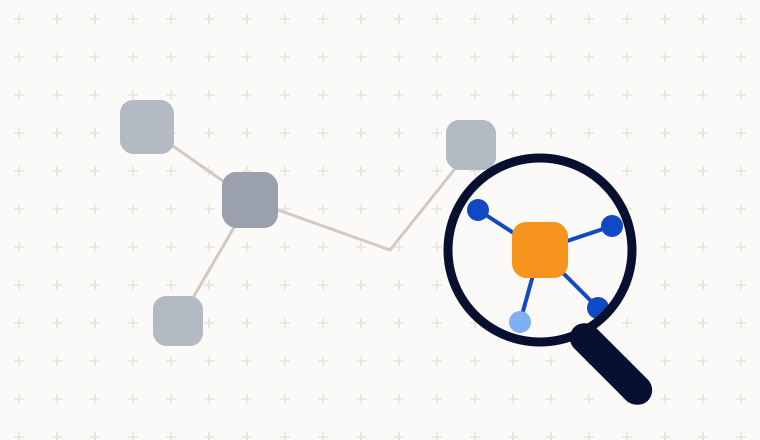
The architectural solution is to move from a collection of disparate tools to a comprehensive intelligence platform that unifies all relevant data into a central knowledge graph—a model that connects entities (like people, accounts, and devices) and the relationships between them. The DataWalk platform is not a standalone graph database; it’s an end-to-end graph + AI system that connects everything—customers, accounts, applications, devices, addresses, and external intelligence—into one coherent, analyzable view.
Achieve Master Entity Views with Precision
The foundation of seeing criminal networks is knowing precisely who is who. DataWalk’s platform includes sophisticated entity resolution capabilities. It fuses records from dozens of disparate sources, resolving fuzzy matches (e.g., “John D. Smith,” “J.D. Smith,” and “Jonathan Smith” at similar addresses) into a single, reliable entity. This process is crucial for countering criminals’ attempts to hide using minor variations in their identity data, serving as a core capability that separates a true platform from a standalone database. As detailed in our analysis of DataWalk vs. a graph database for fraud detection, this is a built-in function, not a separate module or legacy add-on.
Uncover Unknown Networks with Explainable Composite AI
Once data is unified and entities are resolved, DataWalk’s Composite AI identifies suspicious patterns that rules-based systems invariably miss. For example, it can automatically discover an organized fraud ring by identifying a group of applications that use different stolen identities but share a small number of manipulated phone numbers and IP addresses. Crucially, our Composite AI approach is built on explainability. Analysts can see exactly why a connection was flagged, satisfying strict audit and compliance requirements while providing the context needed for swift investigations.
Radically Lower TCO and No Vendor Lock-In
DataWalk is a no-code platform, designed to empower an organization’s internal team to integrate new data sources, build analytical models, and adapt to evolving threats. This self-sufficiency breaks dependency on expensive, multi-year service contracts that define legacy systems. By putting control back in the hands of the enterprise, DataWalk delivers a lower, more predictable TCO and provides the extreme agility needed to stay ahead of adversaries. This approach empowers organizations to enhance their fraud controls in the age of AI without being locked into a vendor’s rigid development roadmap.
Architectural Comparison: Legacy Stack vs. DataWalk Unified Platform
Comparing conventional multi-tool architectures against a unified graph-and-AI platform illustrates key differences in performance, agility, and overall cost.
| Architectural Dimension | Legacy Multi-Tool Stack | DataWalk Unified Intelligence Platform |
|---|---|---|
| Data Architecture | Siloed databases connected via complex ETL pipelines | Unified knowledge graph covering all entities and transactions |
| Entity Resolution | External, third-party software or manual batch reconciliation | Native, real-time deterministic and probabilistic matching |
| Detection Focus | Isolated events and transaction-level rules | Multi-layered network anomalies and graph relationships |
| Model Explainability | Opaque “black box” scores or rigid Boolean passes | Fully auditable visual lineages and explainable scoring |
| Adaptability & TCO | High professional services costs for minor logic updates | No-code self-service rule prototyping in minutes |
Built for Intelligence, Not Just for Alerts
Many organizations operate a broken, siloed architecture that focuses too narrowly on transactions, creating massive inefficiency and leaving them blind to sophisticated, network-based fraud. The solution is a shift to a unified knowledge graph platform that excels at entity resolution and uses explainable Composite AI to connect the dots.
For the enterprise architect, DataWalk offers a clear path to a modern, scalable, and cost-effective investigations architecture, delivering auditable and transparent intelligence. By empowering your teams and freeing your organization from vendor dependency, you can finally build a fraud detection system designed for true intelligence, not just generating alerts.
How DataWalk AI is Transforming Investigative and Intelligence Analytics
Download the eBookFAQ
We already have a graph database. How is DataWalk different?
A graph database is merely a storage engine. DataWalk is a complete, end-to-end platform containing native no-code data ingestion, advanced entity resolution, visual link analysis, scoring, and integrated case management. Custom-building these capabilities around a raw graph database is a multi-year IT project that recreates tool fragmentation.
How transparent are DataWalk’s AI detection models?
DataWalk is engineered around Explainable AI (XAI) principles. All risk models, inference paths, and graph analytics are transparent. Investigators can inspect the exact reasoning and data links that generated a risk score, providing a clear, auditable trail for compliance and court proceedings.
How does the platform handle messy, unstandardized data without upfront ETL?
DataWalk ingests raw structured and unstructured data “as-is” from disparate enterprise sources. Its built-in entity resolution and visual transformation tools clean and fuse records into a single knowledge graph inside the platform, eliminating massive pre-processing ETL projects.
Can DataWalk scale to enterprise-level transaction volumes?
Yes. DataWalk uses a patented hybrid graph-relational architecture optimized for enterprise scale. It queries billions of records seamlessly, maintaining fast sub-second responsiveness without the memory and performance bottlenecks common in traditional pure graph databases.
DataWalk Platform
See DataWalk in action
Request a personalised live demo and discover how DataWalk connects the dots across your data.